The impacts of climate change are becoming increasingly severe year after year. Climate change is now having a significant impact on the environment, society and people’s daily lives as well as on corporate business activities. The Paris Agreement was adopted to promote the global reduction of greenhouse gas emissions, and it was also announced that the EU, the United States and Japan would target net-zero emissions by 2050, and China by 2060. The agreement has heightened expectations not only for countries and governments to fulfill key roles in mitigating climate change, but also for the private sector as well. Companies are expected to implement measures to achieve a low-carbon/ decarbonized society through their business activities. There have also been stronger calls for companies to provide disclosure of climate change-related information stemming from the TCFD*, an initiative led by institutional investors. As a result, opportunities for dialogue on climate change between companies and investors are expanding, including the institutional investor initiative Climate Action 100+ and the TCFD Consortium launched in Japan in 2019. The purpose of these initiatives is to encourage the disclosure of information that will enable investors and other stakeholders to properly monitor and evaluate the climate-related risks of companies.
* The Task Force on Climate-related Financial Disclosures (TCFD) set up by the Financial Stability Board. In June 2017, the TCFD announced its recommendations on climate-related financial disclosures in order for investors to be able to make appropriate investment decisions. Please see the details in the column below. The General Manager of MC’s Corporate Sustainability & CSR Department is a TCFD member, and mainly through its involvement in the task force’s seminars and meetings, MC is supporting the TCFD’s activities and helping its recommendations to take root throughout the business community.
Our planet and its ecosystems, human beings and corporate activities are highly vulnerable to climate change.
At MC, our belief is that while climate change does pose significant threats, it also presents the MC Group with new business opportunities. Accordingly, MC has identified “Contributing to Decarbonized Societies”, which is part of its Materiality, as one of the key issues for management to address and respond to as MC strives to achieve sustainable growth. MC aims to fulfill its mandate to meet the demand for energy, while at the same time helping to achieve international objectives, such as the UN Sustainable Development Goals (SDGs) and the 2℃ target laid out in the Paris Agreement. To realize that aim, MC works in collaboration with a wide range of stakeholders, including governments, other businesses and industry associations. MC also recognizes the importance of climate-related financial disclosures and supports recommendations made by the TCFD. MC continues to strive to expand its information disclosure in line with the recommendations.
COLUMN
The Financial Stability Board (FSB) launched the TCFD in recognition of both the likelihood that climate change would result in further risks and opportunities for businesses in the future, and the heightening concerns about it destabilizing the value of assets and financial markets.
To help the markets to properly evaluate those risks and seize the opportunities they present, the TCFD has established a voluntary framework for climate-related financial disclosures.
Reflecting the need for investors to get a clear picture on how climate-related risks and opportunities will affect future cash flows, assets and liabilities of entities receiving investment to facilitate financial decision-making, the report recommends disclosing key points on Governance, Strategy, Risk Management, and Metrics and Targets.
| Governance | The organization’s governance around climate-related risks and opportunities |
|---|---|
| Strategy | The actual and potential impacts of climate-related risks and opportunities on the organization’s businesses, strategy, and financial planning (including analyses of the 2℃ Scenario, etc.) |
| Risk Management |
The processes used by the organization to identify, assess, and manage climate-related risks |
| Metrics and Targets |
The metrics and targets used to assess and manage relevant climate-related risks and opportunities |
Reference:TCFD website (https://www.fsb-tcfd.org/)
Due to the high degree of uncertainty surrounding the impacts of climate change, MC has adopted a flexible portfolio capable of adapting to medium to long-term changes in its operating environment. MC believes it is vital to capture business opportunities associated with climate change and take appropriate action to mitigate risks. The TCFD provides business entities and investors with guidelines on voluntary climate-related financial disclosures and information useful for their decision making. MC utilizes these TCFD data as benchmarks for verifying its own climate-related action plans, identifying growth opportunities and strengthening risk management in ways that are designed to ensure its sustainable growth. Portions of the TCFD’s recommendations are still in the discussion stages, and others may take several years before action can be taken. Nevertheless, MC will disclose its efforts in a stepwise fashion to strengthen its information disclosure.
Climate change is one of the most important issues acknowledged by MC’s top management. MC’s basic policy on climate change and important matters therein are deliberated and decided upon by its Executive Committee, MC’s officer-level decision-making body. As stipulated in the regulations governing MC's board of directors, the Executive Committee reports its findings regularly (approximately twice a year) to the board, appropriate supervision of which is facilitated by the structure of MC's governance framework.
Before the Executive Committee has addressed basic policy and important matters pertaining to climate change, actions are taken by MC’s Sustainability Advisory Committee and Sustainability & CSR Committee. The former fields opinions and advice from outside experts, and the latter (which reports directly to the Executive Committee) holds extensive hearings with all of the Business Group CEOs. The Business Groups also act independently to address climate change. Group Chief Sustainability Officers and Group Sustainability Managers are appointed within each Group’s department responsible for management strategy in order to oversee sustainability-related initiatives (including climate change) and reflect climate-related opinions and information into their respective businesses and strategies. MC's basic policy on climate change and important matters therein are comprehensively addressed when making decisions on business strategies and screening new loans and investments.
| Basic Policy on Climate Change | Covers climate-related initiatives through MC’s businesses, adoption of TCFD recommendations, details on climate-related financial disclosures, etc. |
|---|---|
| Important Matters | Assessments of climate-change risks and business opportunities (including scenario analyses), greenhouse-gas reduction targets and action plans, etc. |

| Board of Directors | Supervises MC’s climate-related actions and initiatives | Convenes approx. twice a year |
|---|---|---|
| Executive Committee | Makes decisions regarding MC’s basic policy on climate change Makes decisions regarding important matters pertaining to climate change |
Convenes approx. twice a year |
| Sustainability & CSR Committee (reports directly to Executive Committee) | Deliberates on MC’s basic policy on climate change and important matters therein, and reports findings to Executive Committee | Convenes approx. twice a year |
| Sustainability Advisory Committee | Offers advice and recommendations regarding MC’s basic policy on climate change and important matters therein | Convenes approx. twice per year |
| Officer in Charge | Yutaka Kashiwagi (Director, Executive Vice President, Corporate Functional Officer, IT, CAO, Corporate Communications, Corporate Sustainability & CSR) | |
| Department in Charge | Corporate Sustainability & CSR Department | |
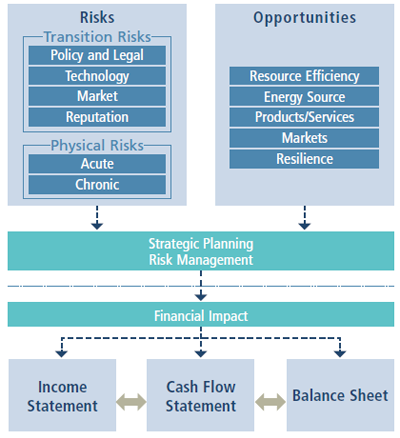
MC considers the risks and opportunities associated with climate change to be key variables in establishing its business strategies, and recognizes the possibility that the impact of climate change on its operations will grow over the medium to long term. Accordingly, MC is identifying where the risks and opportunities are likely to reveal themselves up to and even beyond the year 2030. Regular internal analyses and assessments also factor in changing external trends.
Transition Risks and Opportunities
| Regulations |
|
|---|---|
| Technologies |
|
| Markets |
|
Physical Risks
| Increase in Unusual Weather Patterns |
|
|---|---|
| Climate Change |
|
Scenario Analysis
Name of Selected Business
| STEPS Scenario*1 | 2°C Scenario (SDS)*2 | 1.5℃ Scenario(NZE)*3 | |
|---|---|---|---|
| Demand Outlook | 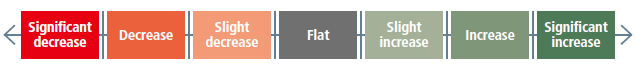 The trajectory forecast from the present to 2040-2050*4 for the global supply and demand related to the selected businesses under the STEPS scenario in publications such as the IEA’s World Energy Outlook and Energy Technology Perspectives is expressed in seven levels (significant decrease, decrease, slight decrease, flat, slight increase, increase, significant increase). |
The trajectory forecast from the present to 2040-2050*4 for the global supply and demand related to the selected businesses under the 2ºC scenario in publications such as the IEA’s World Energy Outlook and Energy Technology Perspectives is expressed in seven levels (significant decrease, decrease, slight decrease, flat, slight increase, increase, significant increase). |
The trajectory forecast from the present to 2040-2050*4 for the global supply and demand related to the selected businesses under the 1.5ºC scenario in publications such as the IEA’s Net Zero by 2050 is expressed in seven levels (significant decrease, decrease, slight decrease, flat, slight increase, increase, significant increase). |
| Awareness of the Business Environment |
Introduction of the general awareness of the business environment as expressed in the STEPS scenario, etc. (BAU scenario) | Introduction of the general awareness of the business environment under the 2ºC (SDS) Scenario. | Introduction of the general awareness of the business environment under the 1.5ºC (NZE) Scenario. |
| Policies and Initiatives Based on the Awareness of the Business Environment |
|---|
| Analysis of the impact to MC’s business based on the awareness of the business environment detailed in the scenarios above, and related policies and initiatives. |


| STEPS Scenario | 2°C Scenario (SDS) | 1.5℃ Scenario(NZE) | |
|---|---|---|---|
| Demand Outlook |
 |
 |
 |
| Awareness of the Business Environment |
In order to respond to an increase in electricity demand, opportunities are anticipated for businesses such as renewable energy and clean gas-fired power generation. However, given the nature of power generation being produced locally for local consumption, MC feels it is important to continue managing businesses by responding to the policies, etc. of each country and region. | Business opportunities are expected to decline in line with the reduction of fossil fuel power generation amount from the 2020s, which will exert downward pressure on profits. Also, in the 2030s, it is anticipated that the strengthening of restrictions and regulations could increase the cost of existing thermal power plants, and the profit structure will further change as gasfired power generation shifts to a dispatchable source of power. Moreover, from the 2040s, thermal power plants used for regulating supply and demand may also be required to reduce their CO₂ emissions, which could necessitate further reductions in operating hours. | The amount of electricity generated from fossil fuels is expected to decrease significantly with the achievement of Net Zero in the power sector in the 2030s in developed countries and in the 2040s in developing countries. Also, significant changes in the cost structure of thermal power plants due to the future tightening and expansion of regulations such as carbon taxes as well as an increase in capital investment in CCUS and other methods expected to reduce CO₂ emissions, are expected to reduce the competitiveness of power from fossil fuels. |
| Policies and Initiatives Based on the Awareness of the Business Environment |
|---|
| As the global trend towards carbon reduction/ decarbonization becomes ever more pronounced, MC recognizes that the resulting increase in risk of stranded assets and reputational damage due to restrictions and tighter regulations on fossil fuel-based power generation businesses could make it difficult to withdraw from existing projects in the future. Accordingly, MC has disclosed specific policies in relation to coal-fired power generation businesses. In the gas-fired power generation business as well, by conducting a risk analysis based on the impacts of climate change. MC will promote strategic divestment from existing power generation assets and consider switching to zero-emission thermal power for retained assets in the effort to achieve a 100% non-fossil power generation portfolio by 2050. |
Policy on Coal-fired Power Generation Businesses (IPP and EPC)
| STEPS Scenario | 2°C Scenario (SDS) | 1.5℃ Scenario(NZE)*1 | |
|---|---|---|---|
| Demand *2 Outlook |
|
 |
|
| Awareness of the Business Environment |
Firm demand growth for steel is anticipated, particularly in locations such as India and Southeast Asia. Steel production is divided into the blast furnace method, which uses iron ore and metallurgical coal and the electric furnace method, which mainly uses steel scrap as raw materials. Although new technologies to replace the current blast furnace method are being researched, from the perspective of technology development trends and economic viability, new technologies are not expected to be developed and spread rapidly, and it is projected that the blast furnace method will continue to be the main method of steel production. | Although the demand for steel is predicted to steadily increase, in line with the introduction of carbon pricing, the proportion of steel produced by the electric furnace method, which uses iron scrap as raw material, is expected to increase steadily, followed by the commercialization of steel production using new low-carbon production methods (e.g. the hydrogen reduction method). However, the shift to a low/ decarbonized society consists of timing and regional differences, and metallurgical coal will continue to be the main raw material during the transition period. While the demand for metallurgical coal is expected to decrease in developed countries and China in the years leading to 2050, seaborne trade volume is expected to increase in developing countries such as India, which rely on metallurgical coal imports. As the pursuit of low/ decarbonization in blast furnaces advances, blast furnaces will be outfitted with CO₂ capture capability with the spread of CCUS, and the demand for high-quality metallurgical coal, which contributes to low-carbonization compared to other grades, is expected to increase. On the supply side, a slowdown in investment in new coal mines due to the increased difficulty in obtaining environmental permits is expected to result in reduced supply. |
Demand for steel, which supports a wide range of manufacturing industries as a base for infrastructure and a basic raw material, is estimated to increase by 12% in 2050 compared to 2020. Although the steel industry is a difficult sector in which to reduce CO₂ emissions, it is expected that the proportion of electric furnace and new steelmaking methods will increase more rapidly than in the 2℃ scenario, that CCUS for blast furnaces will spread more rapidly, and that Net Zero emissions will be achieved in 2050 on the assumption that the blast furnace method will continue in some regions. The achievement of this goal is dependent on the commercialization of the hydrogen reduction method in the 2030s, which is earlier than in the 2℃ scenario. Therefore, although the overall demand for metallurgical coal is expected to decrease toward 2050 in comparison to the 2℃ scenario, it is anticipated that the reduction in demand for high-quality metallurgical coal, which contributes to decarbonization, will be relatively low as a result of plans to further improve the efficiency of blast furnaces to decarbonize them by outfitting them with CCUS. On the supply side, a slowdown in investment in new coal mines and a decrease in supply due to the increased difficulty in obtaining environmental permits and further reduction in future demand forecast compared to the 2℃ scenario. |
| Policies and Initiatives Based on the Awareness of the Business Environment |
|---|
| Since steel is a basic material that is difficult to replace, its demand is expected to remain strong over the long term in line with global economic growth under any scenarios. The steel industry is expected to enter a decades-long transition period in response to the trend toward low/ decarbonization. During this transition period, demand for high-quality metallurgical coal (our main products), is expected to increase relatively more than other quality of metallurgical coal due to its contribution to the low-carbonization of existing blast furnaces. On the other hand, on the supply side, supply from new projects is expected to be limited due to the increasing difficulty of new mine's development, and MC will continue to fulfill our responsibility to provide a stable supply of high-quality metallurgical coal to customers and contribute to the low-carbonization of the steel industry. In the business environment under the 2℃/ 1.5℃ scenarios, our metallurgical coal business will be affected in terms of both supply and demand by the introduction of carbon pricing, the projected increase in the percentage of steel production using the electric furnace method and new low-carbon steelmaking methods, and supply constraints due to the growing trend toward low/ decarbonization. However, as mentioned above, the need for high-quality metallurgical coal in the shift to a low-carbon society is expected to exhibit a relative increase, and it is anticipated that our metallurgical coal business, with its mainstay high-quality metallurgical coal products, will maintain its advantage to a certain extent. MC will continue to strive to strengthen the competitiveness of our metallurgical coal assets by assessing the external environment (which affects the supply of metallurgical coal), as well as the progress of decarbonization in the steel industry, including new technologies (new steelmaking methods, CCUS), electric furnaces, and policies in various countries (which may affect the demand for metallurgical coal). Furthermore, as a concrete initiative in the transition to a low/ decarbonized society, MC is working to reduce GHG emissions in the production process at BMA, our Australian metallurgical coal business through MC subsidiary MDP. Furthermore, in collaboration with BHP, our partner in the metallurgical coal business, MC is considering support research that will contribute to reducing emissions throughout the metallurgical coal value chain, and are considering business initiatives in growth areas that will contribute to the low/ decarbonization of the steel industry. |


| STEPS Scenario | 2°C Scenario (SDS) | 1.5℃ Scenario(NZE) | |
|---|---|---|---|
| Demand Outlook |
 |
|
|
| Awareness of the Business Environment |
In all regions with the exception of Europe, demand for natural gas is expected to increase (average annual growth of 1.4% between 2018-2040), mainly as fuel for power generation to support the increasing electricity demand that will surpass the deployment of renewable energy, as chemical feedstock and as transportation fuel, among other uses. It is recognized that LNG demand in particular will grow due to its high transportability (at an annual rate of 3.4% from 2018 to 2040). | Global gas demand is projected to increase by 8% by 2030 compared to 2018 levels, and then to decrease to 2% below 2018 levels by 2040*. By region, natural gas demand in Asia-Pacific will increase significantly through 2040, primarily in China and India. On the other hand, in North America, Europe and Eurasia, natural gas demand is expected to decrease from 2040. By industry, demand for gas in power generation and for use in buildings will gradually decline, but demand for alternative fuels and heat sources in hard-to-decarbonize sectors such as large-scale transport and heavy industry is expected to increase. | Global natural gas demand and LNG trade are expected to decline by 46% and 33%, respectively, by 2040 compared to 2018. On the other hand, the demand for hydrogen, a next-generation energy source that is expected to support a low/ decarbonized society, will increase especially in the shipping, land transportation, and heavy industry sectors, and the significance of natural gas as a raw material for blue hydrogen is expected to increase further in the future. Approximately half of the total demand for natural gas in 2050 will be directed to hydrogen production, and 40% of hydrogen demand will be sourced by natural gas. |
| Policies and Initiatives Based on the Awareness of the Business Environment |
|---|
| In addition to strengthening the foundations of existing businesses and steadily launching projects under construction, MC will fulfill its responsibility to provide a stable supply of LNG, an important energy source in the transition to a low/ decarbonized society, as well as aim to increase its profits from the LNG business by participating in competitive new projects to meet growing demand, developing demand in emerging markets, and strengthening our sales functions. Global demand for LNG is expected to increase in the medium to long term under the 2°C scenario, while it is expected to decrease under the 1.5°C scenario. However, MC believe demand in Asia to be remained firm for the time being, and also the demand for LNG as a next-generation energy source, such as hydrogen and ammonia, to be grown as well. MC will continue to monitor the policies of various countries, such as the introduction of carbon taxes, and trends in technology development, such as CCUS, which may affect the competitiveness and profitability of our LNG business under the 2°C/ 1.5°C scenarios. At the same time, MC will promote initiatives that contribute to making the LNG value chain itself carbon neutral, and study the possibility of utilizing existing LNG infrastructure for the production and supply of blue hydrogen, in order to strengthen our resilience to the risks associated with the transition to a low/ decarbonized society and to proactively capture opportunities. |
* Compared to 2018 levels, LNG trade volume is expected to increase by 81% by 2040.
| STEPS Scenario | 2°C Scenario (SDS) | 1.5℃ Scenario(NZE)*1 | |
|---|---|---|---|
| Demand Outlook |
|
|
|
| Awareness of the Business Environment |
With global population growth in the medium to long-term and economic growth in developing countries, the demand for passenger cars and trucks is projected to grow significantly (from 2015, +120% in passenger vehicle demand and +150% in truck demand). Alongside a hike in demand for internal combustion engine vehicles, especially in Southeast Asia, demand for electric vehicles (electric vehicles (EVs), plug-in hybrid EVs (PHEVs), and hybrid vehicles (HEVs)) is also expected to grow in China and Europe, due to tightening global environmental regulations. Moreover, the automotive industry is undergoing a once-in-a-century transformation, driven largely by digitization and the CASE (Connected, Autonomous, Shared/ Service and Electric) evolution. Demand for mobility services that take into account the shift from internal combustion engine vehicles to hybrid and electric vehicles is expected to grow, and consumer needs are projected to shift from vehicle owning to shared mobility. | Although the overall demand for automobiles is projected to grow to a certain extent, the cost of owning and operating a vehicle may increase due to the revision of automobile-related tax and regulation systems in each country, such as the tightening of environmental regulations for the automotive industry, resulting in a modal shift towards public transit systems. As such, the level of demand expansion is not expected to be as high as in the STEPs Scenario (Demand in 2040 is expected to be +21.9% compared to 2018 [-24.4% compared to STEPS]). In China and Europe, the shift from internal combustion engine vehicles to electric vehicles is also expected to accelerate. However, due to issues such as installation of power charging infrastructure in emerging markets such as India and Southeast Asia, etc, the demand for internal combustion engines for both passenger and commercial vehicles is expected to be firm. |
Even under the 1.5°C scenario, the overall demand for automobiles is expected to remain almost the same as under the 2°C scenario until 2030. On the other hand, the share of electric vehicles*2; in new vehicle sales is expected to increase from 2% in 2018 to about 80%*3 in 2040 (STEPS scenario: 25%, 2°C scenario: 75%). In developing countries, almost all new vehicle sales are expected to be electric by mid-2030. Furthermore, governments are expected to provide support for the further spread of electric vehicles by encouraging changes in consumer behavior such as through specific policies to limit the number and use of private cars and promote the use of public transportation and ride-sharing. |
| Policies and Initiatives Based on the Awareness of the Business Environment |
|---|
| In ASEAN, which is positioned as a key market and where further growth can be expected, MC handles Mitsubishi Motors Corporation (MMC) vehicles and Mitsubishi Fuso Truck and Bus Corporation vehicles in Indonesia, and Isuzu Motors vehicles in Thailand. MC will continue to be deeply involved in each stage of the value chain (upstream-midstream-downstream) including production, distribution, financing and after-sales services. MC will further strengthen its business foundations in both markets and further expand its value chains into emerging markets represented by ASEAN countries. Although we expect that internal combustion engine vehicles will remain the primary source of vehicle demand in ASEAN for the time being, even under the 2ºC/ 1.5 ºC scenarios, we will contribute to the spread of electric vehicles in terms of sales and production, primarily in the markets we handle, while taking into consideration factors such as the trends of automobile policies including environmental regulations, as well as the current status of distribution and power systems in each country. MC and MMC have been actively working to expand sales of EVs for some time, including by building up sales of PHEV vehicles mainly in the UK and the Netherlands. In anticipation of future growth in demand, MC and MMC launched the first PHEV in Indonesia in FY2019, ahead of other companies in ASEAN. We will continue to contribute to society by expanding sales of electric vehicles, including PHEVs. MC will also maintain the sustainability of its businesses by helping to address societal issues through its mobility service business, as well as by further strengthening its functions and community-based networks built up over many years.Furthermore, as part of our low/ decarbonization efforts, MC plans to promote the realization of a Green Fleet Management Concept, which combines mobility business and EX through collaboration with other business groups within our company. |
| STEPS Scenario | 2°C Scenario (SDS) | 1.5℃ Scenario(NZE)* | |
|---|---|---|---|
| Demand Outlook |
 |
|
|
| Awareness of the Business Environment |
Shipping already comprises 70-80% of the global logistics (including land transport), and as a key component of the transport infrastructure that is irreplaceable amid an ongoing modal shift, demand for shipping is expected to soar (demand in 2070 will be 260% higher than in 2019). The International Maritime Organization (IMO) has set the goal of improving greenhouse gas emissions per transport unit by 40% by 2030 compared to that of 2008, and halving total greenhouse gas emissions by 2050 compared to 2008. From the late 2020s, the shift to next-generation fuels, mainly low-sulfur and LNG fuels with lower environmental impact, is expected to progress. | Although the volume for shipping demand will be lower than STEPS, demand as of 2070 is expected to increase significantly, by 230% compared to 2019. As existing regulations are tightened and new rules are brought in, the use of next generation fuels such as biofuels, hydrogen and ammonia fuels, as well as low-sulfur and LNG fuels will increase exponentially (by 2050, the fuel share of what are now mainstream fossil fuels will have decreased by more than 20% compared to 2019). These changes will compel the shipbuilding industry to develop and build new types of ships using the next generation of fuels as mentioned instead of heavy oil fuels and establish a supply chain network and a supply infrastructure at ports for the same. | Although the shipping demand will decrease compared to the STEPS and 2°C scenario, the overall growth trend is expected to remain unchanged, with a 153% increase in 2050 compared to 2019. On the other hand, the market share of marine fuels is expected to change dramatically, and the share of next-generation fuels such as hydrogen and ammonia is expected to increase, with the share of fossil fuels in 2050 decreasing by more than 80% compared to 2019. Although the shipping sector is considered to be one of the industries that will not achieve net-zero emissions by 2050 due to the long service life of ships, the time required to switch to next-generation fueled ships, and the difficulty of electrification, it is assumed that emissions will decrease by an average of about 6% per year by 2050. |
| Policies and Initiatives Based on the Awareness of the Business Environment |
|---|
| The shift to next generation fuels expected above may generate demand for refurbishment and replacement of vessels owned by MC in the future, but as switching to next generation fuels and developing supply infrastructure will accelerate after 2030, the extra cost borne by MC for such refurbishment and replacement of vessels currently owned by MC is expected to be very limited. We will seek out fresh new business opportunities by monitoring trends in the switchover to next-generation fuels, performance, costs and infrastructure, as well as the price of constructing new ships, freight rates and the state of supply systems. In the bigger business picture, the additional costs associated with the fuel required for operation will remain incumbent on the shipper/ operator, which will limit the risk to MC. By exploring new business targeting next generation fuels such as hydrogen and anmonia, and developing and introducing advanced vessels, MC will make our business more sustainable and add value to the coastal shipping industry. |
* Based on the available data, the demand forecast is as of 2070 for the "STEPS scenario" and the "2°C scenario," while it is as of 2050 for the "1.5°C scenario."
| STEPS Scenario*2 | 2°C Scenario (SDS)*2 | 1.5℃ Scenario(NZE)*2 | |
|---|---|---|---|
| Demand Outlook |
|
|
 |
| Awareness of the Business Environment |
Global oil demand is expected to increase by approximately 7% in 2040 compared to 2018 (104 million barrels per day), as rising oil demand in emerging economies outpaces declining demand in Europe and other developed countries due to electrification and energy conservation. Growing demand for oil in the transportation sector, especially as fuel for passenger cars, aviation, and ships, is expected to be significant, offsetting the decline in demand in the power generation sector. | Compared to the STEPS scenario, there is a significant decrease in oil demand, especially in the transportation sector, and demand in emerging economies will peak in 2030 before starting to decline, resulting in a global demand decrease of about 32% in 2040 compared to 2018 (66 million barrels per day). | Oil demand is expected to decline by approximately 56% in 2040 compared to 2018 (43 million barrels per day), mainly due to further increases in the rate of electrification. The proportion of internal combustion engine vehicles that use petroleum-based fuels in new vehicle sales is expected to decline to about 20%*3 by 2040 (STEPS scenario: 75%, 2°C scenario: 25%). As oil prices are expected to decline due to a significant decrease in oil demand, the market share of certain low-cost producers, including OPEC, is expected to increase. In response, it is believed that policies and regulations are needed to avoid a recovery in oil demand caused by falling oil prices. |
| Policies and Initiatives Based on the Awareness of the Business Environment |
|---|
| As a company that has been involved in the supply of petroleum products that support social infrastructure for many years, MC will continue to fulfill our responsibility to provide a stable supply of various fuels and raw materials and will work to transform our business into a next-generation energy service station business utilizing our nationwide customer base and assets as a platform. Although domestic demand for petroleum products is expected to gradually decline in the medium-to-long term, in the short term, MC will pursue an optimal business portfolio by optimizing the domestic service station business while strengthening its competitiveness in a timely manner, and by expanding the fleet station business based on the sale of diesel fuel for cargo vehicles in response to increasing logistics demand. Furthermore, in the medium to long term, in addition to building a supply base for next-generation energy including hydrogen, MC will work on the vehicle maintenance business utilizing digital technology and the next-generation network business by combining and upgrading the functions of logistics bases. |

| 2°C Scenario (SDS) | 1.5°C Scenario (NZE) | |
|---|---|---|
| Demand Outlook |
|
|
| Awareness of the Business Environment |
Under a 2ºC Scenario, it is believed that policies to capture renewable energy as a main power source will become mainstream. It will be necessary to promote deregulation and technological innovation to construct an energy system that is not only sound environmentally, but economically and socially as well. Regarding this point, MC understands the need for multifaceted initiatives involving technologies that support the expansion of renewable energy while maintaining safe and stable supplies of power (energy storage, hydrogen, transmission technology, supply and demand adjustment technology, and energy trading) and anticipates that these markets will expand. As the expansion of renewables progresses together with the proactive deployment of renewable technologies in each region around the world, starting with offshore wind in Europe, the grid configuration and supply of power will change. As a result, opportunities are anticipated for energy transmission and businesses that regulate the supply and demand for power such as battery storage, services using storage batteries, and VPP (virtual power plant) businesses. In the renewable energy generation business, as is the case for thermal power generation, given the nature of power generation being produced locally for local consumption, MC feels it is important to continue managing businesses by responding to the policies, etc. of each country and region. On the other hand, as the market expands and commoditization progresses, cost competition is expected to intensify. Furthermore, MC recognizes that trends towards decentralization of the energy system driven by the spread of renewable energy, batteries and other technologies along with movements around thermal power generation, including next-generation types, may vary greatly in terms of timing and content depending on the status of government regulation and technological innovation, as well as the country or region. |
Under a 1.5ºC Scenario, electricity demand is expected to double by 2040, with about 85% coming from renewable energy sources, assuming the further spread of electrification. In particular, solar and wind power are growing rapidly, and will require about 18 times (for solar) and 10 times (for wind) more additional capacity than in 2019. This means that additional solar and wind power generation capacity of approximately five times the average of the last three years will be required every year after 2020, and continuous large-scale investment will be essential to achieve this goal. Also, in line with the expansion of renewable energy, power generation amount of which varies according to weather conditions and which has a strong aspect as a distributed power source, further business opportunities are expected to increase, such as the expansion of transmission capacity, utilization of storage batteries, and demand response, which will contribute to improving the flexibility of the power supply and demand system. In addition, due to the rapid progress of electrification in a variety of fields, the significance of policies and regulations to strengthen and ensure the security of the electricity supply and demand system is expected to increase further. |
| Policies and Initiatives Based on the Awareness of the Business Environment |
|---|
| Under the 2°C/ 1.5°C scenarios, energy management services that utilize battery storage, electric vehicles (EVs), and plug-in hybrid vehicles (PHVs) are expected to become widespread due to the increased introduction of renewable power generation (solar and wind) in the shift toward a low-carbon society as well as changes in the power business structure (increased need for grid stabilization due to increased VRE*). The introduction of renewable energy and the spread of battery storage, as well as the accompanying trend toward decentralization of the power supply system, will vary according to country and to region depending on the status of policies, regulations, and technological innovations, and the timing of their manifestation may also differ significantly. While taking into account the characteristics of each country and region, MC will work to increase the business value of the entire power value chain by promoting the integration of supply-side power generation and demand-side retail businesses, while optimizing our portfolio to "double renewable energy power generation capacity by FY2030 compared to FY2019 (from 3.3 GW to 6.6 GW). In addition, we will promote the energy management and virtual power plant (VPP) businesses, which are becoming increasingly necessary as renewable energy becomes more widespread. Based on this policy, we are actively engaged in the development of offshore wind power generation and distributed power supply businesses, mainly in Japan, the US and Europe. |
* VRE: variable power source whose output fluctuates, such as solar and wind power (abbreviation for "variable renewable energy").
| 2°C Scenario (SDS)*1 | 1.5℃ Scenario(NZE)*2 | |
|---|---|---|
| Demand Outlook |
|
 |
| Awareness of the Business Environment |
Under the 2°C scenario, Electric Vehicles (EV) (including hybrids), which emit less CO₂, and renewable energy generation, mainly wind and solar power, are expected to become more widespread worldwide. Demand for copper is expected to increase by 40% in 2040 compared to 2020 (the STEPS scenario: 32% increase) due to the greater use of highly conductive copper in EVs compared to Internal Combustion Engine vehicles (ICEV), as well as the increase in power generation and associated transmission and distribution networks that are essential for accelerating electrification. On the supply side, copper supply against demand is expected to be tight in the future due to difficulty in expansion and new development at mines. |
Under the 1.5°C scenario, the need to further reduce CO₂ emissions will accelerate the spread of EVs (including hybrids) and renewable power generation, especially wind and solar. As a result, copper demand is expected to increase even further compared to the 2°C scenario; about 60% in 2040 compared to 2020. While there are many mines and projects that are difficult to expand or newly develop, copper demand is expected to grow more rapidly than under the 2°C scenario, further tightening the balance of copper supply and demand. |
| Policies and Initiatives Based on the Awareness of the Business Environment |
|---|
| Under both the 2°C and the 1.5°C scenarios, copper demand is expected to increase steadily due to the widespread use of EVs (including hybrids) and renewable power generation, and the associated development of power transmission and distribution networks, while copper supply and demand is expected to tighten due to the increasing difficulty of developing new copper projects. MC is currently participating in copper mining projects in Chile and Peru, and have a production capacity of 200,000-250,000 tons per year. MC plan to start production at Quellaveco mine in FY2022, which is currently under development, and our equity production is expected to increase by 120,000 tons per year, i.e., to 300,000 tons per year. We will continue to position the copper business as the core of our metal resources business, along with high quality metallurgical coal, and strive to increase the value of our existing assets, while at the same time considering opportunities to develop new competitive projects, in order to fulfill our responsibility to provide a stable supply of copper to customers. In addition, as a measure to reduce environmental impact, we will promote initiatives such as switching to renewable energy sources for electricity used in operations at the copper mines in which we have invested. At the same time, we will closely monitor trends in new technologies that will improve the recovery rate of copper resources for the effective use of resources. |

「2)分析結果」の「原料炭事業」、「銅事業」夫々の表を添付の通り挿入
Physical climate risks (e.g. floods, droughts and temperature increases) could affect the operations of some of the MC Groupʼs businesses.
In order to comprehensively understand the potential physical risks that climate change poses to the MC Group’s business, MC has conducted following assessment.
1) Process
MC has a large global portfolio of companies with diverse and widespread assets. To determine which of the MC Group’s assets are potentially most exposed to the physical impacts of climate change, MC is undertaking the following systematic process:


| Hazard Exposure Rating | Description |
|---|---|
| High | Overall hazard score greater than 30 |
| Medium | Overall hazard score 15-30 |
| Minimal | Overall hazard score less than 15 |
| Hazard Rating | Description of Hazard Severity and Level of Recommended Action |
|---|---|
| 4 | Present-day hazards causing material impacts. Adaptation strategies should be evaluated and deployed. |
| 3 | Imminent hazards likely to result in material impacts during the planning time horizons. Adaptation strategies should be developed in the near future. |
| 2 | Lower likelihood or lower impact hazards which may occur during the asset hold period but are unlikely to cause material impacts and/ or for which more information is required. Impacts should be monitored but may not need action at this time. |
| 1 | Hazards currently modeled to have minimal impact and/ or to occur after the planning time horizons; may be re-evaluated in the future. |
| 0 | Site is not exposed to this hazard. |
2)Assessment Results
The results of the assessment are shared with each MC Group company to inform their future adaptation measures. The current measures and future adaptation strategies for assets that received a red hazard ranking for any of the hazard types covered by the assessment are detailed below.
Metallurgical coal business
| Assets subject to assessment | Mines and coal terminal owned by BHP Mitsubishi Alliance (BMA)* |
|---|---|
| Location | Australia |
| Type of hazard | Stormwater flooding |
| Current measures | Given that flooding due to heavy rain at mines has the potential to disrupt operations, the following measures have been implemented to improve resilience of the sites to flooding since the last flood events in 2011:
|
| Future adaptation strategies | MC together with BMA will continue to enhance physical risk mitigation in response to climate change forecasts. |
* To address the risk of the storm surges associated with cyclones at the coal terminal, which was ranked as orange in the assessment, the latest port berth infrastructure installed has been designed to withstand a 1 in 1000 year wave event factoring in rises in sea levels and cyclone impacts due to climate change. An additional project is currently underway to upgrade an older berth to the same design standard.
Copper business
| Assets subject to assessment | Copper mines owned by Anglo American Sur, S.A |
|---|---|
| Location | Chile |
| Type of hazard | Drought |
| Current measures | While most of the water required for the operations is reused within the mine, a certain amount is lost due to evaporation and other factors, and this water must be replenished from external sources. Since in the drought condition, there is a possibility that sufficient water intake may not be possible which could affect operations, resilience measures are considered through increased procurement of industrial wastewater and treated sewage from third parties. |
| Future adaptation strategies | In addition to the current measures, further diversification of external water procurement is under consideration. Moreover, new technologies to further improve water reuse efficiency at the operations are also being considered. |
3) Incorporation into Business Strategy
The above assessment will allow MC to identify assets that are most exposed to climate hazards and will enable MC to prioritize adaptation measures and incorporate them into business strategy.
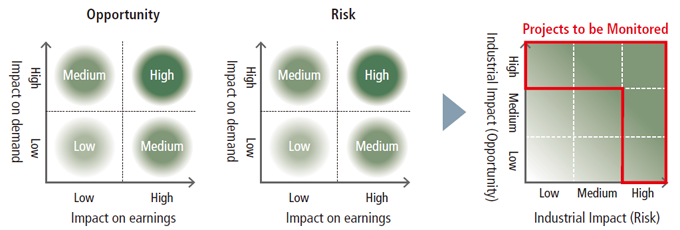
MC regularly assesses which climate-related risks and opportunities warrant the most attention through both regular internal and external surveys, and makes official determinations and assessments at the Sustainability & CSR Committee, which consists of Group CEOs from each of MC’s Business Groups. The specified risks and opportunities are applied under MC’s sustainability promotion framework from two perspectives: Strategic Planning and Project-by-Project Business Management.
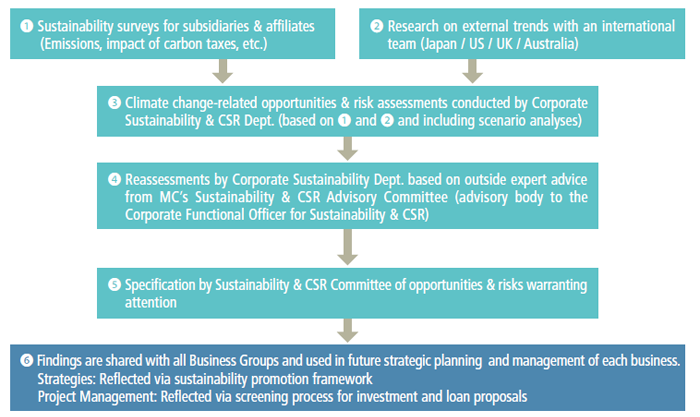
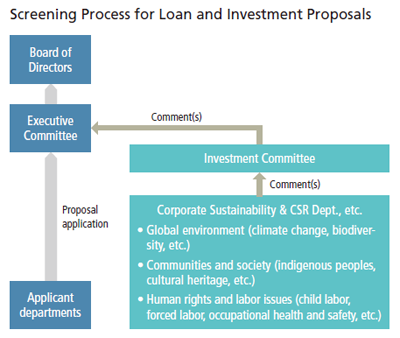
When reviewing and making decisions on loan and investment proposals, MC has adopted a process in which the Investment Committee deliberates all proposals to be discussed by the Board of Directors and the Executive Committee comprehensively based not only on economic aspects, but on ESG factors as well. By having the General Manager of the Corporate Sustainability & CSR Department take part in Investment Committee meetings as a committee member, MC has put in place a screening process to facilitate decision-making that takes into account environmental and social impacts. Besides screening new and exit proposals, the Investment Committee also strives to help make improvements to existing business investees by monitoring their management practices. From the perspective of climate change-related transition risks and opportunities, review of proposals and decision-making takes into consideration quantitative data such as greenhouse gas emissions as well as national policies and industry trends.

MC has set the following climate-related targets to capitalize on opportunities and mitigate risks on a consolidated basis.

Reference:For the relevant data, please see the Initiatives, Performance Data and Additional Reference Data sections, and the Water Resources section.
MC considers transitioning to a low-carbon society to be one of the key issues for management to address and respond to, and through its businesses, MC is working to reduce and eliminate carbon in a variety of fields.
In particular, under the name of Energy Transformation (EX), we are taking on the challenge of reforming the energy field with a view to a low-carbon/ decarbonized society, and evolving our energy-related business portfolio in the process. By addressing the common issue of decarbonization across all industries in this way,
we aim to both meet environmental challenges and fulfill our social mission of providing a stable supply of energy, which will lead to the sustainable growth for MC over the medium- to long-term.

【IIF野田ロジスティクスセンター(産業ファンド)】/CASBEE、DBJ Green Building認証

【ミューザ川崎】/CASBEE

【大黒町物流センター】/CASBEE、BELS
MC has set greenhouse gas reduction targets on a consolidated basis and works with MC Group companies on emissions reduction initiatives. Each of MC’s Business Groups (including the Corporate Staff Section) establish their own emission reduction plans utilizing EMS (Environmental Management System), thereby ensuring that measures to reduce emissions are uniquely tailored to each business. MC will continue to confirm progress on a regular basis, make policy improvements and share best practices.
MC, which has approximately 1,700 group companies, is working to ascertain and reduce greenhouse gas emissions at the Group company level. Every year, each Business Group identifies priority subsidiaries and affiliates, checks their reduction plans and follows up on their progress. In the year ended March 2021, a major update of the environmental performance survey was conducted, expanding the survey’s scope. Through this and other means, we are continuously striving to improve the accuracy of both qualitative and quantitative data on greenhouse gas reduction activities and to obtain a timely understanding of the results.
MDP
MDP, one of MCʼs consolidated subsidiaries, is promoting the reduction of greenhouse gas emissions in its metallurgical coal business BHP Mitsubishi Alliance (BMA) in Australia. BMA is evaluating and undertaking various emission reduction initiatives such as; procuring renewable energy , methane gas reduction and diesel fuel displacement.
In 2020, BMA signed a five-year contract to switch half of the electricity demand of its mines to electricity derived from low-carbon power sources such as renewables (solar, wind etc.). This initiative will reduce BMA’s electricity Scope 2 emissions by about 50% by 2025. The cumulative reduction amount would be approximately 500,000 tons (MDP portion). This initiative will support the development of new solar and wind farms in Queensland, contributing to the transition to sustainable energy use and new job opportunities in the region.
Mitsubishi Corporation Life Sciences Limited
Mitsubishi Corporation Life Sciences (MCLS), an MC subsidiary, is contributing to society by working to achieve sustainable development that takes the environment into account. MCLS has taken steps to reduce its environmental impact. At its main production site, the Saiki Plant, belonging to the wholly-owned subsidiary Kohjin Life Sciences, it has introduced an innovative method called gas turbine combined cycle, which combines gas turbine cogeneration with existing steam turbines. This initiative received an award for excellence in the industrial category at the Cogeneration Grand Prix in the fiscal year ended March 2021, hosted by the Advanced Cogeneration and Energy Utilization Center.
In June 2021, Kohjin Life Science's cogeneration project was registered under the J-credit system in accordance with its implementation guidelines.
Reference:J-Credit Scheme
Major Reduction Activities at MC Group Companies
Reference:CDP Climate Change 2021 Response
| Stage of development | Number of initiatives | Estimated total annual savings in CO₂ equivalent emissions (CO₂/ tons) |
|---|---|---|
| Under investigation | 3 | - |
| To be Implemented | 3 | 467,693 |
| Implementation Commenced | 5 | 832 |
| Implemented | 3 | 764 |
COLUMN
We support the Ministry of the Environment's "Fun to Share" and "Cool Choice" campaigns, promote our greenhouse gas reduction efforts, and widely disclose the details of our efforts.

MC recognizes the necessity of collaborating with a wide range of stakeholders including governments, companies and industry associations in order to achieve the transition to a low-carbon/ decarbonized society.
Accordingly, MC proactively participates in a number of initiatives with external stakeholders.
| Industry Groups: | When assessing whether to join or continue membership with an industry group, MC confirms whether the group’s initiatives related to climate change are consistent with MC’s Basic Policy on Climate Change. Through active participation in the discussions of climate change working groups, with a focus on organizations including the Japan Business Federation (Keidanren), the Japan Foreign Trade Council and the World Business Council for Sustainable Development (WBCSD), each of which MC is a member of, MC is promoting initiatives to contribute to the transition to a low-carbon/ decarbonized society. |
|---|---|
| Government/ Public Office: | MC supports initiatives that contribute to a low-carbon society such as the expansion of renewable energy, the development and implementation of next-generation technologies such as CCUS and hydrogen, as well as increased disclosure of ESG information, including about climate change. MC participates in training seminars and also engages in individual meetings and discussions on topics related to initiatives backed by Japanese government bodies including the Ministry of Economy, Trade and Industry and the Ministry of the Environment such as expanding utilization of the TCFD guidelines and renewable energy usage. MC actively participates in activities to support the response of Japanese companies to climate change, in particular starting with the formulation of green investment guidance as a planning committee member company of the TCFD Consortium. MC also endorses the basic concept of the Green Transformation League (GX League), which the Ministry of Economy, Trade and Industry is planning to establish. We have announced our involvement in a secretariat that will make preparations for launching the GX League, which will consist of other endorsing companies. Through our active involvement in the establishment of the GX League, we will contribute to efforts to address climate change. |
Reference: CDP Climate Change 2021 Response
* Please refer to C12.3
COLUMN
Participation in the Carbon Recycling Fund Institute
The Carbon Recycling Fund Institute was established in August 2019 with the aim of both addressing issues around global warming and improving global energy access through innovations in carbon recycling. MC has been a member since XXXX. Through access to the latest information on carbon capture, utilization and storage (CCUS) and enhanced networking with member companies, we aim to pursue business opportunities and contribute to solving climate change issues.
MC actively disseminates information regarding its measures related climate change to its various stakeholders around the world. MC engages with CDP, an NGO which holds the world’s largest database of corporate disclosures on climate change initiatives, and since the fiscal year ended March 2004, MC has responded to the CDP Climate Change Questionnaire, which is used for evaluating the climate change management of companies. For further information, refer to MC’s CDP Climate Change 2021 Response.
Reference: CDP Climate Change 2021 Response
Following its new Green House Gas (GHG) emission reduction targets announced in FY2021, the fiscal year ended March 31, 2022 (Reference: Metrics and Targets), MC calculates GHG emissions based on the GHG Protocol’s equity share approach from FY2021, including the GHG emissions of its affiliates.
(The amount of Scope1&2 (for MC and subsidiaries) and Scope 3 Category 15 (Investments) under the GHG Protocol’s financial control approach are also indicated for comparison with other companies that have adopted this approach.)
(*1、*2、*3)| 2020.3 | 2021.3 | 2022.3 | |
|---|---|---|---|
| GHG Emissions (Unit: thousand t-CO₂e) | 11.1 | 9.3 | 3.4★ |
| Energy Consumption (Unit: GJ) | 207,159 | 177,178 | 175,679★ |
| Electricity Consumption (Unit: MWh) | 15,566 | 13,067 | 12,767★ |
| CO₂ Emissions from Logistics (Unit: thousand t-CO₂)*4 | 40 | 26 | 24★ |
Scope of Aggregation (Non-Consolidated):
• GHG emissions, energy consumption, electricity consumption and CO₂ emissions from logistics: Head Office, domestic branches and offices, training centers and other facilities
| 2020.3 | 2021.3 | Ref. 2021.3 |
2022.3 | Ref. 2022.3 |
||
|---|---|---|---|---|---|---|
| Calculation approach ( location/market-based for Scope2) |
Control (Location) |
Control (Location) |
Equity (Market) |
Equity (Market) |
Control (Market) |
|
| GHG Emissions (Unit: thousand t-CO₂e) | 9,437 | 9,185 | 24,016 | 22,852★ | 8,319 | |
| Components | Scope 1 (including 6.5 gases) | 6,884 | 6,774 | 21,829 | 21,046★ | 7,343 |
| Scope 2 | 2,553 | 2,411 | 2,187 | 1,806★ | 975 | |
| Ref. Scope3 (Category15) (Unit: thousand t-CO₂e) | - | - | - | - | 15,158 | |
| Energy Consumption (Unit: GJ) | 106,075,971 | 103,990,961 | - | 310,173,320★ | - | |
| Electricity Consumption (Unit: MWh) | 4,399,057 | 4,165,874 | - | 5,309,580★ | - | |
| CO₂ emissions per total assets (Unit: million t-CO₂e/ trillion yen)*5 | 0.68 | 0.64 | - | 1.03 | - | |
| 2020.3 | 2021.3 | 2022.3 | ||
|---|---|---|---|---|
| Total amount of 6.5 Gases emissions*6 | 878 | 848 | 2,096★ | |
| Components | Carbon dioxide(CO₂) | 8 | 8 | 333★ |
| Methane(CH₄) | 870 | 840 | 1,722★ | |
| Dinitrogen monoxide(N₂O) | 0.3 | 0.4 | 40★ | |
| Hydrofluorocarbons (HFCs) | 0 | 0 | 0★ | |
| Perfluorocarbons(PFCs) | 0 | 0 | 0★ | |
| Sulphur hexafluoride(SF₆) | 0 | 0 | 0★ | |
| Nitrogen trifluoride(NF₃) | N/ A | N/ A | N/ A | |
| 2020.3 | 2021.3 | 2021.3 | |
|---|---|---|---|
| Natural Gas Group | 245 | 350 | 3,172 |
| Industrial Materials Group | 149 | 125 | 407 |
| Petroleum & Chemicals Solution Group | 165 | 123 | 1,222 |
| Mineral Resources Group | 2,872 | 2,782 | 3,201 |
| Industrial Infrastructure Group | 83 | 86 | 126 |
| Automotive & Mobility Group | 20 | 15 | 140 |
| Food Industry Group | 1,195 | 1,135 | 1,430 |
| Consumer Industry Group | 1,523 | 1,442 | 241 |
| Power Solution Group | 3,168 | 3,111 | 12,889 |
| Urban Development Group | 6 | 5 | 20 |
| Corporate Staff Section | 11 | 9 | 4 |
Scope and approach of Aggregation (Consolidated)
ESG Data marked with a star (★) for the year ended March 2022 has received independent practitioner’s assurance from Deloitte Tohmatsu Sustainability Co., Ltd.
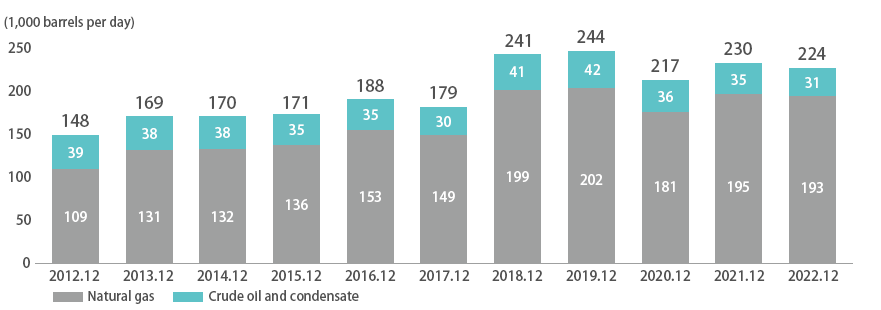
MC’s equity share of oil and gas upstream production is as shown below. Burning natural gas results in relatively lower GHG emissions compared to other fossil fuels, and demand for natural gas is forecast to continue to increase in line with the transition to a low-carbon and decarbonized society. Accordingly, MC has positioned natural gas as a core business. Currently, natural gas accounts for approximately 80% of MC’s equity share of oil and gas production.

| Project | Beginning of Production |
Annual Production Capacity (Million Ton) |
Buyer | Seller | Shareholding | MC’s Participation |
Business Contribution*4 |
||
|---|---|---|---|---|---|---|---|---|---|
| Total | MC’s |
||||||||
| Brunei | 1972 | 7.2 | 1.8 | 25% | JERA, Tokyo Gas, Osaka Gas, etc. | Brunei LNG | Brunei Gov.(50%), Shell(25%), MC(25%) | 1969 |  |
| Malaysia I (Satu) |
1983 | 8.4 | 0.42 | 5% | JERA, Tokyo Gas, Saibu Gas, etc. | Malaysia LNG |
PETRONAS(90%), Sarawak Gov.(5%), MC(5%) | 1978 |  |
| Malaysia II (Dua) |
1995 | 9.6 | 0.96 | 10% | Tohoku Elec., Tokyo Gas, Shizuoka Gas, Sendai City Gas Authority, ENEOS Holdings, etc. |
Malaysia LNG |
PETRONAS(80%), Sarawak Gov.(10%), MC(10%) | 1992 |  |
| Malaysia III (Tiga) |
2003 | 7.7 | 0.31 | 4% | Tohoku Elec., Tokyo Gas, Osaka Gas, Toho Gas, JAPEX, Korea Gas, Shanghai LNG, etc. | Malaysia LNG Tiga |
PETRONAS(60%), Sarawak Gov.(25%), JXTG Holdings(10%), DGN (MC/ JAPEX =80:20)(5%) | 2000 | |
| North West Shelf |
1989 | 16.9 | 1.41 | 8.33% | Tohoku Elec., JERA, Tokyo Gas, Shizuoka Gas., Toho Gas, Kansai Elec., Osaka Gas, Kyushu Elec., Guandong Dapeng LNG | NWS | Woodside(33.3%), Shell, bp, BHP, Chevron、MIMI [MC/ Mitsui & Co.=50:50], 16.7% respectively | 1985 |  |
| Oman | 2000 | 7.1 | 0.20 | 2.77% | Osaka Gas, Korea Gas, Itochu Corp., bp, etc. | Oman LNG | Oman Gov.(51%), Shell(30%), TotalEnergies(5.54%), MC(2.77%), etc. | 1993 |  |
| Qalhat | 2005 | 3.3 | 0.13 | 4% | Osaka Gas, Mitsui & Co., Union Fenosa Gas, etc. | Qalhat LNG |
Oman Gov.(46.8%), Oman LNG(36.8%), Naturgy(7.4%), Osaka Gas(3%), MC(3%), etc. | 2006 | |
| Russia Sakhalin 2 | Oil: 2008 (year-round production), LNG:2009 |
9.6 | 0.96 | 10% | JERA, Tokyo Gas, Kyushu Elec., Toho Gas, Hiroshima Gas, Tohoku Elec., Saibu Gas, Osaka Gas, Korea Gas, etc. | Sakhalin Energy LLC |
Gazprom(50%), Sakhalin Energy LLC(27.5%), Mitsui & Co.(12.5%), MC(10%) | 1994* *PSA execution |
|
| Indonesia Tangguh |
2009 | 7.6 | 0.75 | 9.92% | Tohoku Elec., Kansai Elec., SK E&S, POSCO, Fujian LNG, Sempra Energy, PLN, etc. | Tangguh | bp(40.2%), MI Berau [MC/ Inpex Corporation 56:44](16.3%), KG Berau Petroleum [MIBJ (MC/ Inpex Corporation 56:44) 16.5%, Mitsui & Co. 20.1%, JX Nippon Oil & Gas Exploration Corporation 14.2%, Japan Oil, Gas and Metals National Corporation 49.2%](8.6%), etc*2 | 2001*3 | |
| Indonesia Donggi - Senoro |
2015 | 2.0 | 0.9 | 44.9% | JERA, Korea Gas, Kyushu Elec., etc. | PT. Donggi- Senoro LNG |
Sulawesi LNG Development Limited[MC/ Korea Gas=75:25](59.9%), PT Pertamina Hulu Energi(29%), PT Medco LNG Indonesia(11.1%) | 2007 | |
| Wheatstone | 2017 | 8.9 | 0.28 | 3.17% | Chevron, KUFPEC, Woodside, Kyushu Elec., PEW, etc. | Equity Lifting Model*1 |
Chevron(64.136%), KUFPEC(13.4%), Woodside(13%), Kyushu Elec.(1.464%), PEW(8%; of which MC holds 39.7%) | 2012 |  |
| Cameron | 2019 | 12.0 | 4.0*2 | 33.3%*2 | MC, Mitsui & Co., TotalEnergies (Toller) | Tolling Model*1 | Sempra(50.2%), Japan LNG Investment [MC/ NYK=70:30](16.6%) Mitsui & Co.(16.6%), TotalEnergies(16.6%) | 2012 | |
| Total | 100.3 | 12.12 | |||||||
| Project | Beginning of Production |
Annual Production Capacity (Million Ton) |
Buyer | Seller | Shareholding | MC’s Participation |
Business Contribution*4 |
||
|---|---|---|---|---|---|---|---|---|---|
| Total | MC’s |
||||||||
| Indonesia Tangguh (Expansion) |
2023 | 3.8 | 0.38 | 9.92% | PLN, Kansai Elec. | Tangguh | Same as above | Same as above | |
| LNG Canada | Mid 2020’s | 14.0 | 2.1*3 | 15%*3 | Shell, PETRONAS, PetroChina, MC, Korea Gas | Equity Lifting*1 |
Shell(40%), PETRONAS(25%), PetroChina(15%), Diamond LNG Canada Partnership [MC/ Toho Gas=96.7%/ 3.3%](15%), Korea Gas(5%) | 2010 | |
| Total | 17.8 | 2.48 | |||||||
 Investment in exploration & development,
  Investment in liquefaction plant,
  Marketing and/ or import agent,
  Shipping
| Country | Power |
Fuel | Net (Net, 10,000 kW) |
|---|---|---|---|
| Japan | MCKB Energy Services | Gas、Biogas | 3.2 |
| Japan | MC Kawajiri Energy Services | Gas | 3.8 |
| Japan | MC Shiohama Energy Services | Gas、Coal | 9.8 |
| Japan | MCJ Energy Services | Gas | 2.2 |
| Japan | Gonoike Bioenergy Services | Biomass exclusive combustion | 1.1 |
| Japan | MCM Energy Services | Coal、Biomass mixed combustion | 5.2 |
| Japan | MC Hokuetsu Energy Services | Gas | 2.0 |
| Japan | Mizushima Energy Center | Coal | 5.6 |
| Country | Power |
Net (Net, 10,000 kW) |
|---|---|---|
| USA | Frontier | 23.2 |
| USA | Wildflower/ Indigo | 13.6 |
| USA | Wildflower/ Larkspur | 9.4 |
| USA | Mariposa | 20.0 |
| USA | Sentinel | 42.4 |
| USA | CPV Valley | 36.0 |
| USA | Westmoreland | 35.3 |
| Mexico | Tuxpan II | 24.8 |
| Mexico | Tuxpan V | 24.8 |
| The Netherlands | Gas generation owned by ENECO | 75.4 |
| Jordan | IPP-3 | 20.1 |
| Qatar | Facility D | 50.4 |
| Thailand | Gas generation owned by EGCO | 20.2 |
| Japan | Naoetsu Energy Center | 10.7 |
| Country | Power Plant | Fuel | Net (Net, 10,000 kW) |
|---|---|---|---|
| Thailand | Coal-fired power projects owned by EGCO | Coal | 8.3 |
| Taiwan | Ho-Ping | Coal | 26.4 |
| Japan | Nippon Paper Ishinomaki Energy Center | Coal Biomass Co-generation |
4.4 |
| Japan | Nakoso IGCC Power GK | Coal | 14.4 |